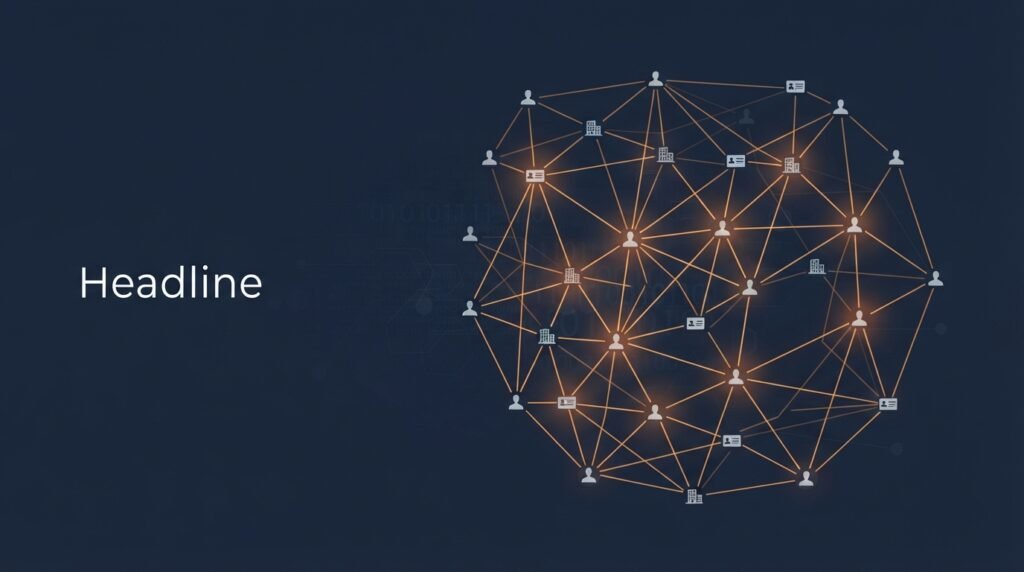
A single record rarely tells you much on its own. A shell company registered in one country. A bank account in another. A name that shows up on a handful of unrelated documents. Individually, these are just data points. The moment you connect them to each other, a pattern can emerge that none of them showed alone — and that act of connecting is what investigators call link analysis, or connection analysis: identifying and mapping relationships between people, accounts, organizations, and infrastructure to reveal patterns that isolated records never show by themselves.
Here’s how this technique actually works, a real example of what it can uncover, and the discipline that separates a rigorous investigation from a chart full of unverified lines.
The case that put link analysis on the map
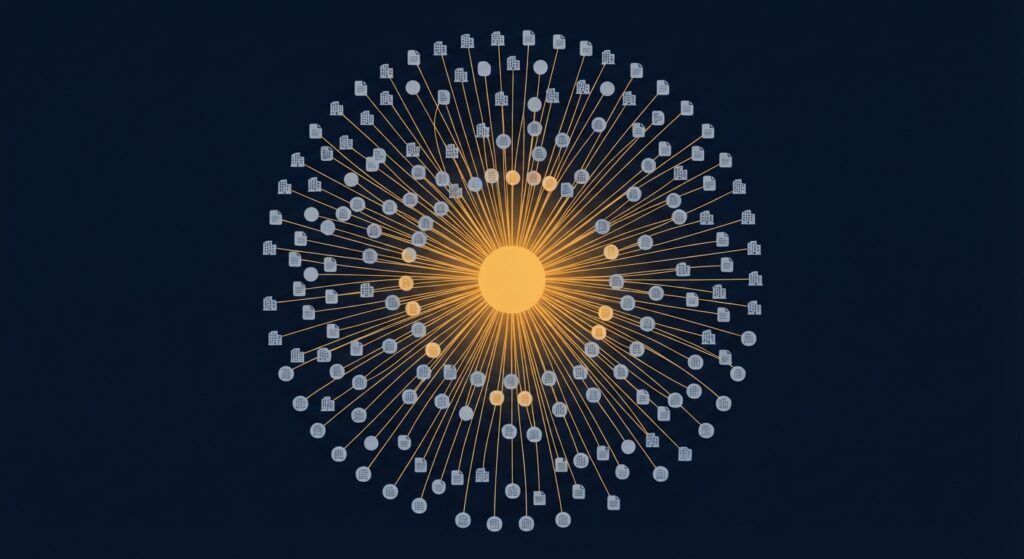
In 2016, journalists working on the Panama Papers investigation faced 11.5 million leaked documents — 2.6 terabytes of financial and legal records tied to a single law firm — with no obvious way to make sense of the volume. Using graph database and visualization software, the International Consortium of Investigative Journalists built out a network of more than 275,000 nodes and 400,000 relationships, connecting individuals, shell companies, and bank accounts that had no obvious link when viewed as separate documents. Once mapped, HSBC and its affiliates emerged as one of the network’s biggest hubs, tied to more than 2,300 shell companies — a connection that was effectively invisible until the relationships between individual records were actually drawn out.
That’s the core value link analysis provides: turning a pile of disconnected records into a picture of who is actually linked to whom, and how.
What actually gets connected
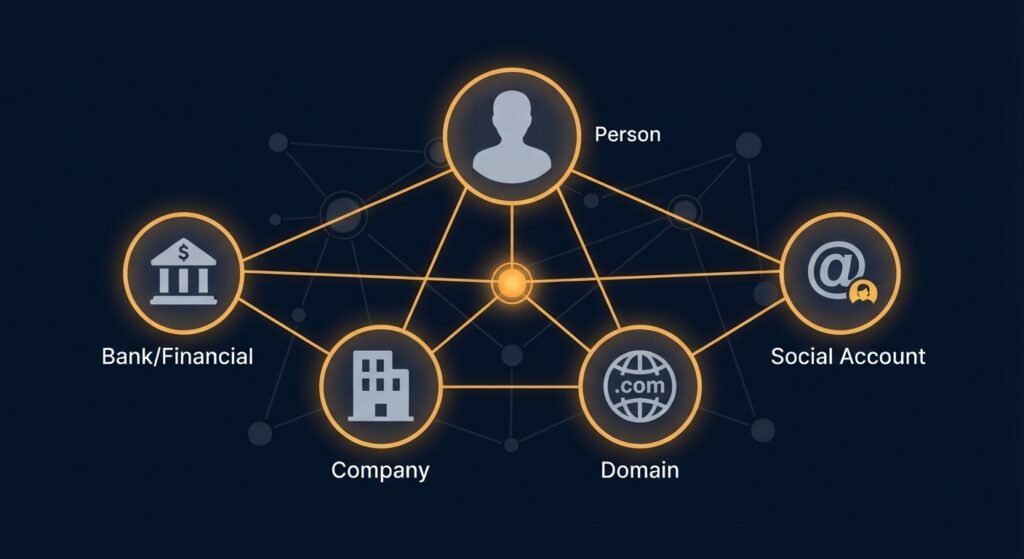
Link analysis works by treating each piece of information as an “entity” — a node on a graph — and drawing an “edge,” or connecting line, wherever a relationship exists between two entities. In practice, this typically involves:
- People and aliases — matching usernames, email addresses, and pseudonyms that trace back to the same individual across different platforms.
- Corporate structures — ownership records, registered agents, and directorships that reveal how companies relate to each other, including shell company chains designed specifically to obscure who actually controls something.
- Digital infrastructure — domains, IP addresses, and hosting relationships that connect seemingly unrelated websites or online operations back to a common source.
- Financial relationships — shared bank accounts, payment flows, or transaction patterns that connect otherwise separate entities.
- Social and communication patterns — shared contacts, co-mentions, or overlapping activity that suggest a relationship between people or organizations.
The workflow, from a single thread to a full picture
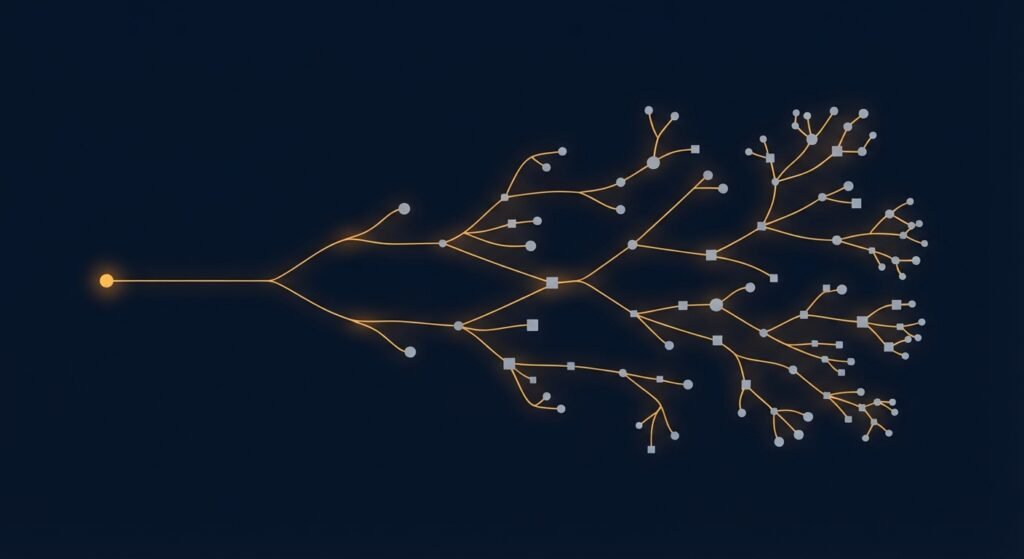
A link analysis investigation typically starts with one known identifier — a name, a domain, a leaked email address — and expands outward from there:
- Establish the starting entity. Begin with whatever concrete identifier you already have, and be specific about what question you’re actually trying to answer.
- Pull related records. Search public records, breach databases, corporate registries, and social platforms for anything connected to that starting point.
- Add each new entity to the graph, drawing a connection only where a real, sourced relationship exists — not based on assumption or coincidence.
- Pivot outward from new nodes. Each new entity you add can itself become a new starting point, revealing another layer of the network.
- Look for hubs and clusters. The most revealing patterns often aren’t a single connection, but a node with an unusually high number of relationships — like HSBC’s role in the Panama Papers network — or a tight cluster of entities that all connect to each other but not to the broader graph.
Modern platforms increasingly automate large parts of this — link-analysis tools can now ingest entities and draw relationships across more than a hundred data sources automatically, and some can render graphs with up to a million entities using multiple visual layouts to help spot patterns a flat list never would.
Where investigators go wrong
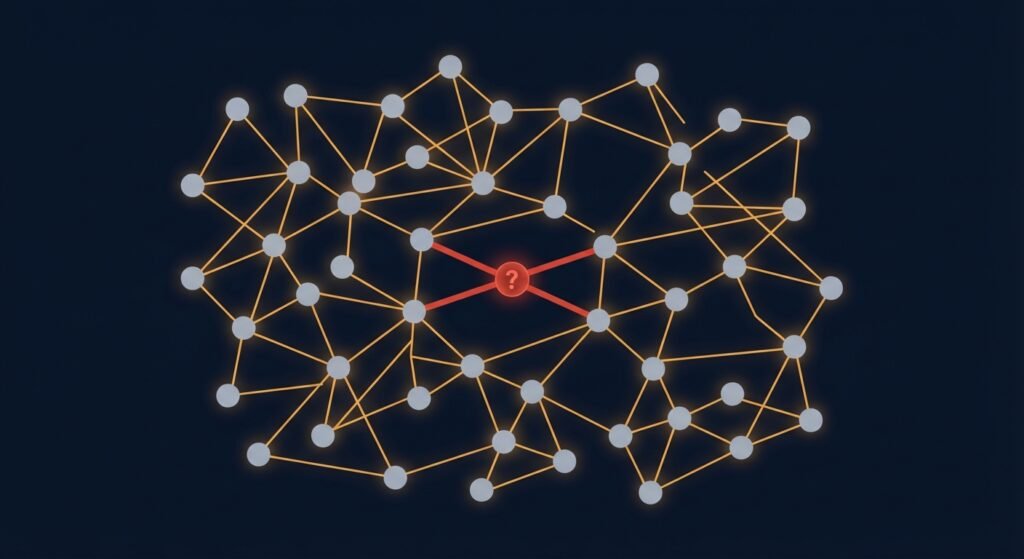
A graph full of connections looks authoritative, which is exactly why it’s dangerous when the underlying links aren’t solid. A few disciplines separate a defensible investigation from a chart that just looks convincing:
- Every edge needs a source. A connection on the graph should trace back to a specific, documented piece of evidence — not an assumption that two similar names or overlapping details must be related.
- Actively look for evidence that disproves your working theory, not just evidence that confirms it. This structured approach — sometimes called Analysis of Competing Hypotheses — is a deliberate defense against confirmation bias, which is easy to fall into once a graph starts suggesting a pattern you expected to find.
- Preserve evidence as you go. Web pages get deleted, accounts get taken down, and a pattern you documented yesterday might be unrecoverable tomorrow if you didn’t archive it — timestamped screenshots and saved source links matter as much as the graph itself.
- Separate verified facts from analytical judgment, both while building the graph and when presenting findings. A confirmed ownership record and an inferred relationship based on circumstantial pattern-matching are not the same category of evidence, and treating them the same undermines the whole investigation.
- A high volume of connections isn’t the same as a strong case. As covered in our post on the human-in-the-loop problem, automated tools can surface far more potential links than a human could review manually — which makes deliberate verification of what actually gets included in the final picture more important, not less.
The bottom line
Link analysis turns scattered, individually unremarkable records into a picture that can reveal exactly the kind of pattern no single document would ever show on its own — the Panama Papers investigation is proof of how much that can uncover at scale. But a graph is only as trustworthy as the discipline behind each connection drawn on it. The investigators who get this right aren’t the ones with the biggest graph; they’re the ones who can trace every line back to a real, documented source, and who actively looked for reasons their own theory might be wrong before publishing it.
This builds directly on our earlier posts on the OSINT toolkit and the human-in-the-loop problem — both worth reading alongside this one if you’re moving from individual lookups into full relationship mapping.
Leave a Reply