
Here’s the honest version of this promise before anything else: you can’t stand up a full SIEM from absolute zero and have a polished SOC dashboard running in under an hour. Installing Wazuh alone typically wants 4+ GB of RAM just for its indexer, and real build logs from people who’ve done this report wrestling with TLS certificates, data source authentication, and field mapping along the way. What is realistic in under an hour is the part most guides skip over: taking data you already have flowing into Wazuh, Elastic, or a similar stack, and turning it into an actual dashboard using a free template instead of building every panel from scratch.
That’s what this post and the attached template are for. If you don’t have a SIEM running yet, treat the setup as a separate weekend project, then come back here for the dashboard itself.
What you need before the clock starts
For the under-an-hour version to actually be true, you need:
- A data source already running and collecting alerts — Wazuh is the most common free starting point, since it ships with its own agents and a built-in alert index.
- Grafana installed, which on most Linux systems is a single package install and a service start, typically 10 minutes including the repository setup.
- Network access between Grafana and your data source, meaning Grafana needs to actually be able to reach your Wazuh indexer’s address and port.
If any of those three aren’t true yet, that’s the part that takes real time, and it’s worth doing separately rather than rushing it to hit an hour.
The two honest paths
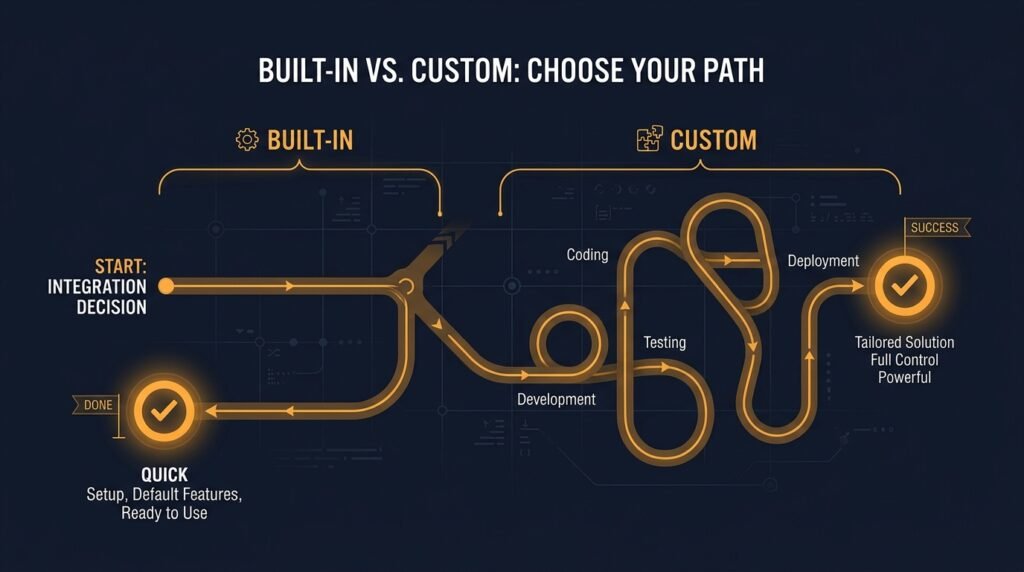
Path 1: use what’s already there. Wazuh ships with its own dashboard, built on OpenSearch Dashboards, that shows alerts, agent status, and compliance data the moment agents start reporting. If your actual goal is “see my alerts in a dashboard,” you may already have this and just not know it. This path takes zero extra building.
Path 2: Grafana, with a free template. If you want something more customizable, faster to read at a glance, or easier to share outside your security tooling, Grafana is the common choice, and it’s where the under-an-hour template below actually saves you time. Building panels one at a time, writing each query, choosing each visualization type, is the part that eats hours. Importing a pre-built template and adjusting it is not.
Setting up the free template (the actual under-an-hour part)
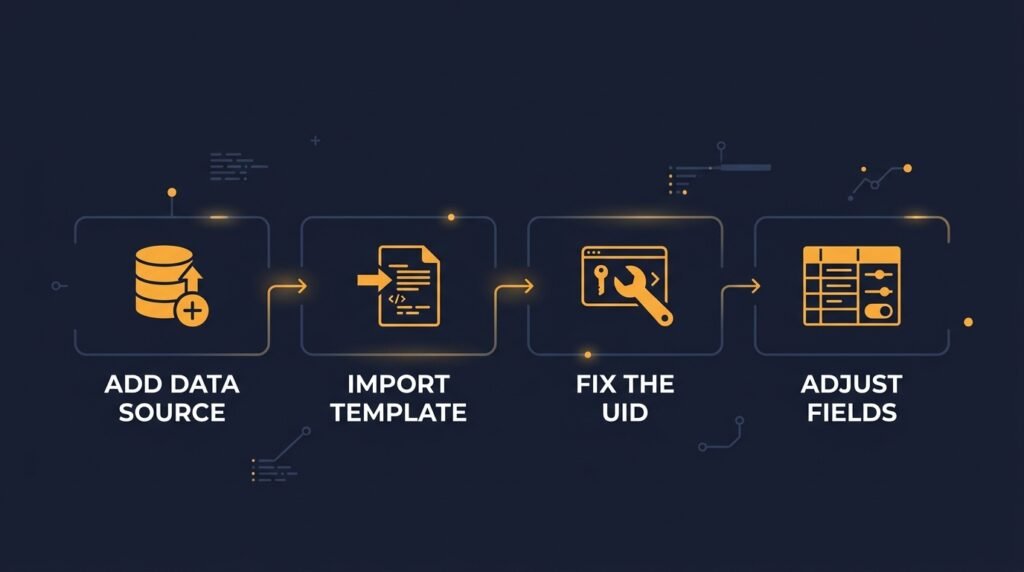
- Add your data source in Grafana. Go to Connections, add a new data source, and select Elasticsearch or OpenSearch depending on your Wazuh version. Point the URL at your Wazuh indexer (commonly port 9200), enable Basic Auth with your Wazuh credentials, and if you’re using self-signed certificates in a lab, enable “Skip TLS Verify.” Set the index pattern to match your alerts, typically
wazuh-alerts-4.x-*. - Import the free dashboard template (linked below). In Grafana, go to Dashboards, New, Import, and paste in or upload the JSON file.
- Fix the datasource UID — this is the step almost everyone trips on. A dashboard exported from someone else’s Grafana instance references their data source by an internal ID, not yours. After importing, open the dashboard’s JSON model (Dashboard Settings, JSON Model) and replace the placeholder data source references with your own. This single step accounts for most of the “why is my imported dashboard showing no data” confusion beginners run into.
- Check your field names match. Wazuh 4.x uses dot notation for fields —
rule.level, notrule_level;agent.name, notagent_name. Dashboards built for older Wazuh versions or different schemas can reference the underscore versions and silently return nothing. This is the second most common reason a freshly imported dashboard looks empty even when the data source connection itself is working fine. - Adjust the time range and refresh rate to match how you’ll actually use it — a live monitoring view wants a short refresh interval, while a weekly review dashboard doesn’t.
If your data source is already live and reachable, steps 1 through 5 realistically take 30 to 45 minutes, which is where the “under an hour” promise actually holds.
What the free template includes
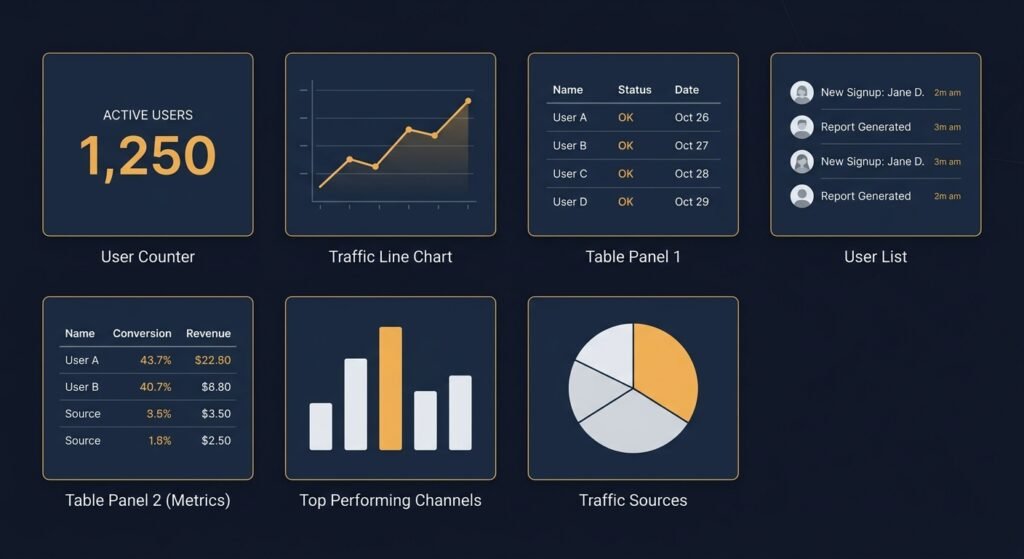
The template attached to this post includes the panels most beginner-to-intermediate SOC dashboards actually need, based on how real home-lab and small-team setups are commonly built:
- Total alerts and critical alert counts, as quick-glance stat panels.
- Alerts over time by severity, so you can see whether things are trending up or down, not just the raw volume.
- Top triggered rules, showing what’s actually firing most often — often the fastest way to spot a noisy, under-tuned detection.
- Top MITRE ATT&CK techniques observed, which pairs naturally with the ATT&CK Navigator if you want to visualize which tactics your environment has coverage for, and which ones you have no visibility into at all.
- Agent status, so you can tell at a glance which monitored systems are actually reporting in.
- Top source IPs, useful if you’re running a honeypot or an internet-exposed lab device specifically to generate real attack traffic to analyze.
Every panel in the template is intentionally simple rather than polished, on purpose — it’s meant to be a starting skeleton you adjust to your own data and naming, not a finished product you import and never touch again.
What to do once it’s actually running

A working dashboard is a good stopping point for an hour, but it’s also a genuinely strong project to document further. As covered in our post on building a cybersecurity portfolio with no job experience, a documented home lab project — what you built, why, and what you learned adjusting it to your own data — is exactly the kind of evidence hiring managers say they actually want to see, more than another certification alone. Screenshot the dashboard, write up the field-mapping gotcha you hit and how you fixed it, and that’s a portfolio piece, not just a weekend tinkering session.
The bottom line
A genuinely complete SOC build from zero infrastructure isn’t an hour’s work, and any guide claiming otherwise is skipping the install and configuration time that real build logs consistently show takes longer. But if you already have alerts flowing somewhere, turning that into an actual readable dashboard, using a free template instead of building every panel from scratch, realistically is close to an hour’s work, and the template below is built to get you there.
Download the free template: soc-dashboard-starter-template.json — import it into Grafana, point it at your own data source, and fix the UID as described in step 3 above.
This pairs with our earlier posts on the SIEM comparison and SOC analyst burnout statistics — a dashboard that actually surfaces what matters, instead of raw noise, is one of the few things that measurably helps with both the detection and the burnout side of SOC work.
Leave a Reply